Your Google Analytics Dashboard is emailed to you once a week.
- We can change the frequency if you would like, just ask.
- We can also provide you with direct access.
There are three pages:
- Page Statistics gives you a general idea of how many visits you have had, where they came from, what they were looking at, and how well you are engaging them.
- Location & Type gives you a broad idea of where (in the World & United States) visitors are coming from.
- eCommerce/Demographics give you a great idea of where people are coming from. The eCommerce section will only contain data if you have an eCommerce store on your website.
Google Analytics 4 was just recently rolled out and I am learning more about the data and how to capture and display it. If you would like to have direct access to your Google Analytics you will need an email associated with a Google account, like Gmail. Once you have that I can send you an invitation to view your Analytics in-depth.
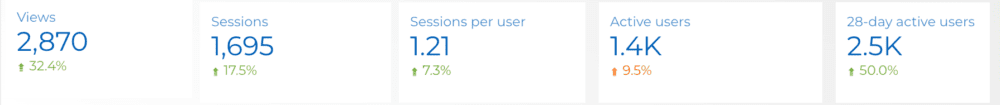
A pageview is only unique the first time a user lands on a page during a single session. If a user leaves the site and comes back, starting a new session, they can revisit the same page and trigger another unique pageview. Active users are just users of your website.
A pageview is when a page on your website is visited by a user. A session is a collection pageviews by a user.
Sessions per User counts the average number of sessions initiated by each user or visitor to your website. This metric is mainly used to determine how frequently users return to your website.
Active Users currently represents 1-day active users. We will be changing this by next week to reflect 7-Day Active Users.
28-Day Active Users: the number of unique users who initiated sessions on your site in the past 28 days.
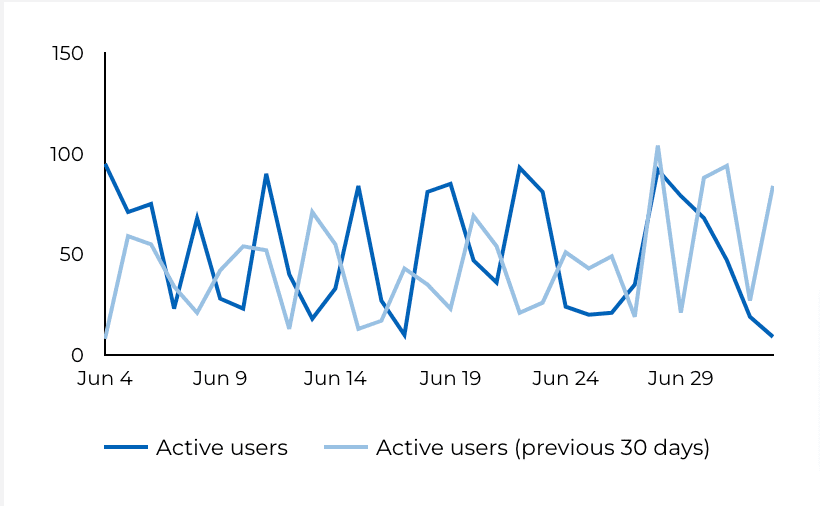
How are Active Users Trending
The active users report in Google Analytics helps you understand the retention rate of your website. It reports on how often visitors come back to your website over a certain time period.
Session Engagement
An engaged Session is defined as a session that spent 10 seconds or more on the site or viewed 2 or more pages or had a conversion event.
The average engagement rate varies by industry.
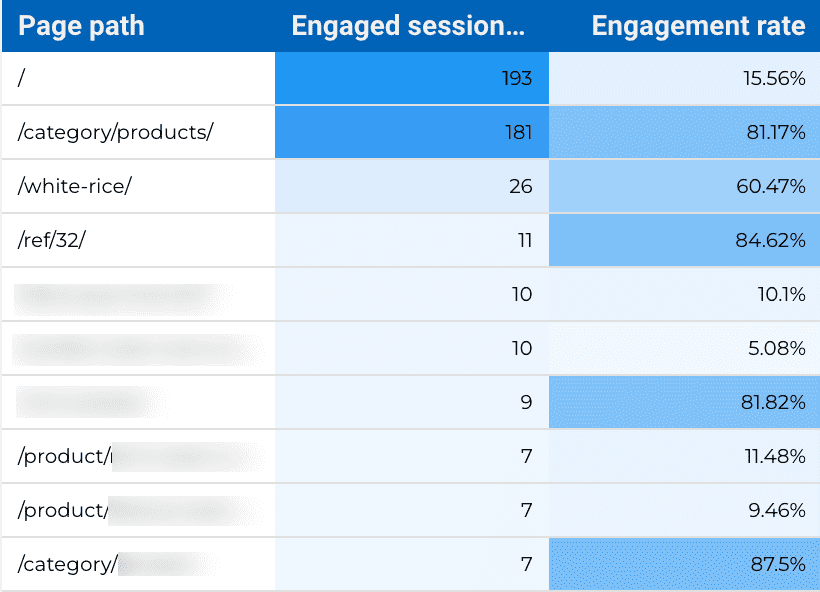
What Pages get the most Views
You want to include links to underlying pages to route traffic appropriately. It is about providing people with the information they are looking for and leading them to it. A low engagement rate usually means you led them to something they weren’t expecting or didn’t want or you didn’t provide them with a way to convert them.
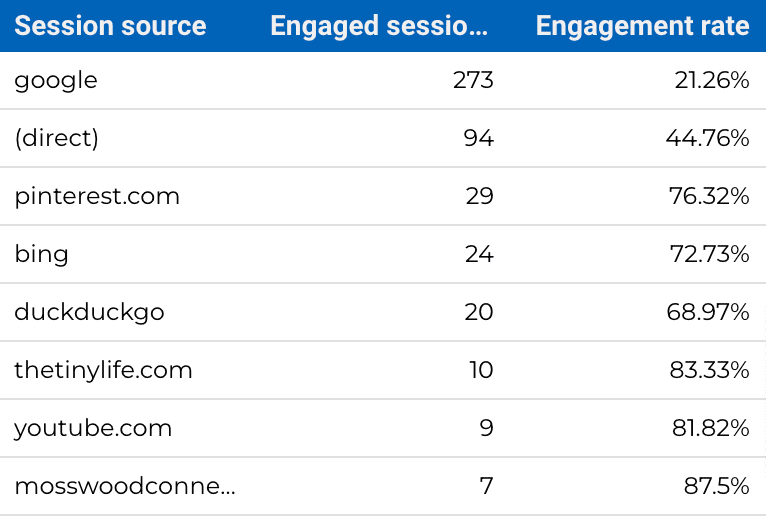
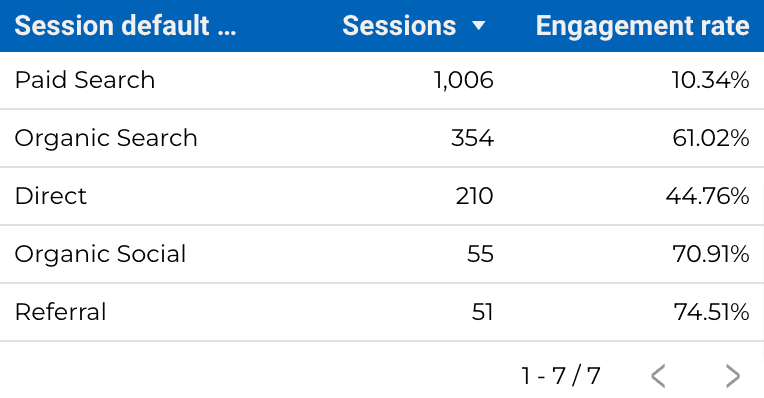
Session/Source Engagement
Session/Source Engagement shows how well you engaged your audience based on where they came from on the internet. (direct) is someone who came directly to your website.
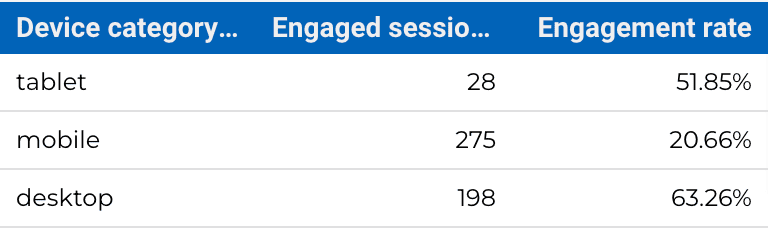
Device Engagement
Device engagement can help you refine the views of your website using different size devices. For example; if you have a low engagement rate on mobile devices you might want to consider removing videos and other content that could slow it down. Or change the arrangement of your “calls to action” on a mobile device.
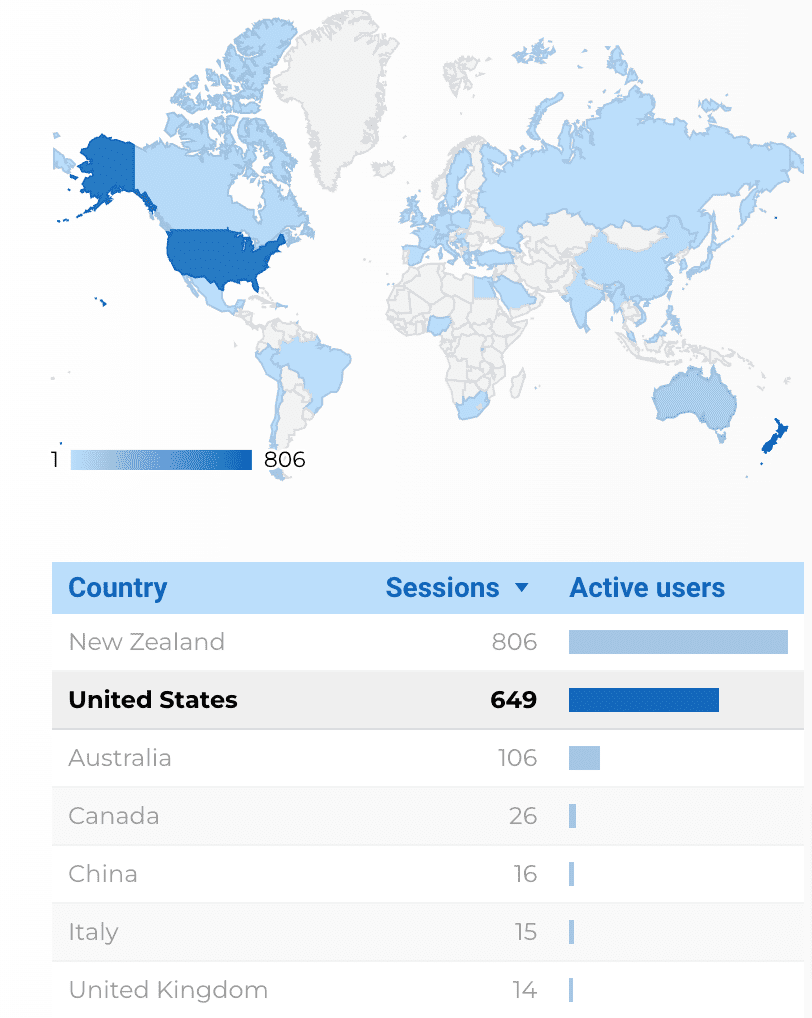
Sessions by Country
This metric is primarily for clients who market internationally. I have blocked foreign countries for many websites that are not marketing internationally due to spam issues.
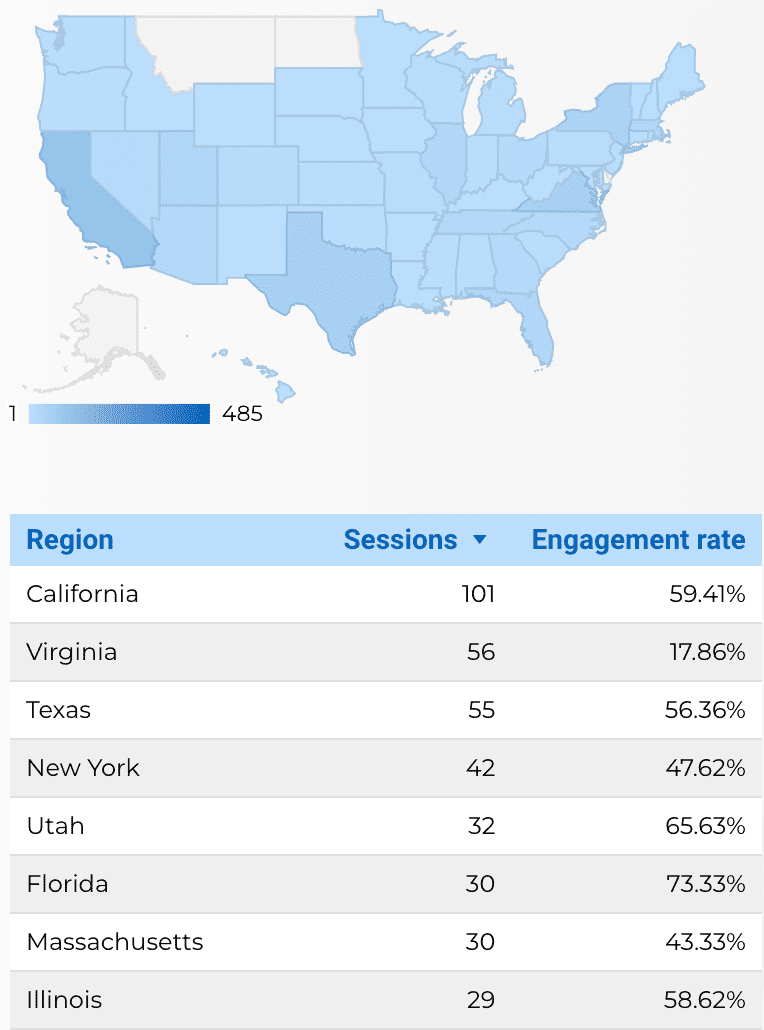
United States Sessions
This metric is for clients who market domestically. (not set) indicates that the user has blocked this information.
Special Note about Virginia: Virginia is where Amazon Bots come from. We have software that should disregard bot traffic, but it is not full-proof. If you are marketing to Virginia please be aware that bot traffic may affect your analytics. We have filtered traffic from Virginia for most analytics.
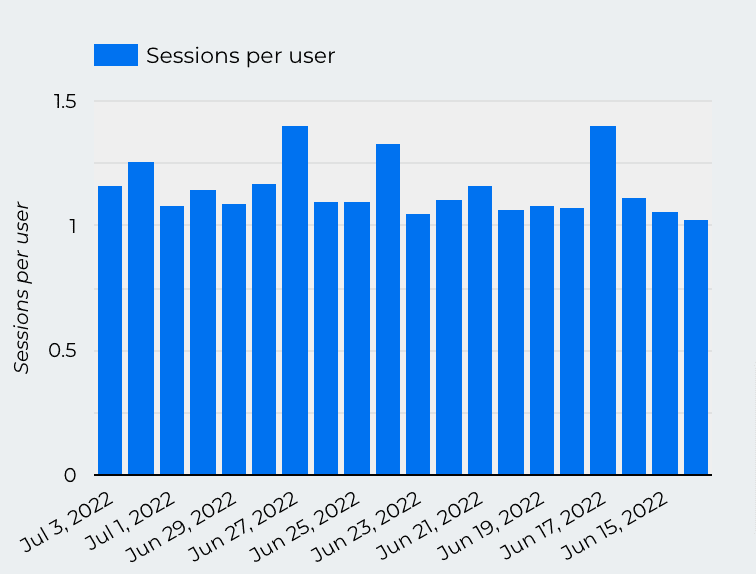
Sessions per user
1.6 sessions per user means that a decent proportion of your visitors return for another session, meaning your online content is attractive.
Less than 1.2 sessions per user mean that most users are only visiting once – what content could you provide to bring them back?
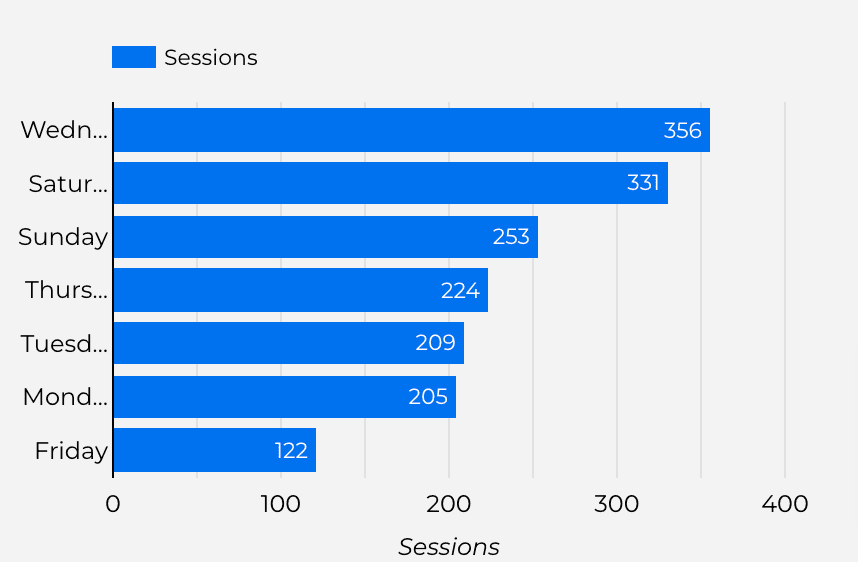
Sessions by Day of the Week
Sessions by Day of the Week can let you know what day of the week is most popular with your visitors. This could be because of when you release information or just the user’s buying habits. It can help you refine your advertising and posting schedule.


This section is for clients with eCommerce systems. This metric isn’t working as expected and will be refined in July so that August should show more meaningful data.
Demographic Data
Demographic metrics like Gender can only be collected if the user opts into cookies on your website.
You must meet the Analytics data thresholds to see demographic and interest data. Google may withhold data to prevent anyone from inferring the identity of individuals based on their demographics and interests. For example, if there are fewer than N instances of Gender=male in a report, then data for the male value may be withheld.
Unknown: Keep in mind that not all visitors have opted-in to ad personalization. Also, not all visitors of your website have Google accounts (or maybe they are browsing anonymously, etc.). This means that not every visitor will be mapped with age/interest/gender data.
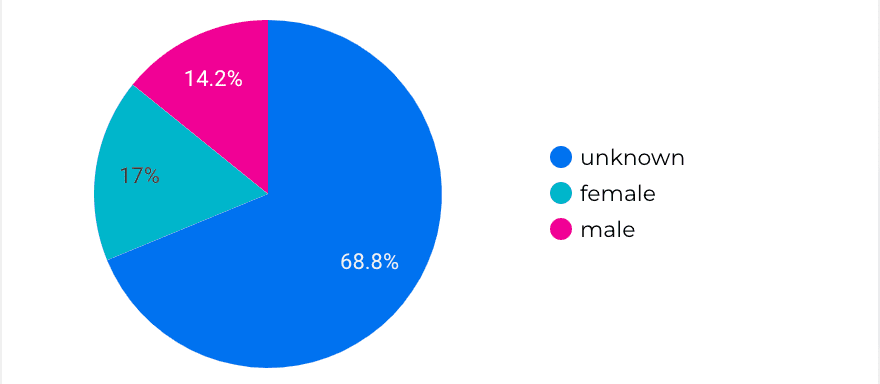
Gender
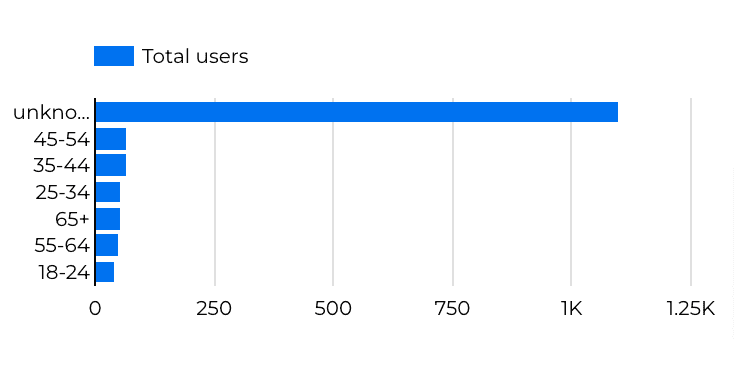
Age

Thinking of starting an Ad Words Campaign?
Make sure you let us know so we can link it to your Google Analytics.
Other Tracking
We can do some targeted tracking too. If you have something specific you want us to track let us know.